- BiologyDiscussion.com
- Follow Us On:
- Google Plus
- Publish Now


Experiments on Ecology | Biology
ADVERTISEMENTS:
Are you researching on experiments on ecology ? You are in the right place. The below mentioned article includes a collection of nineteen experiments on ecology: 1. Community Structure Study 2. Biomass Study 3. Soil Science 4. Aquatic Ecosystem 5. Physico-Chemical Analysis of Water.
- Experiments on Physico-Chemical Analysis of Water
1. Experiment on Community Structure Study: (8 Experiments)
1. Aim of the Experiment:
To determine the minimum size of the quadrat by species area-curve method.
Requirements:
Nails, cord or string, metre scale, hammer, pencil, notebook.
i. Prepare a L-shaped structure of 1 × 1 metre size in the given area by using 3 nails and tying them with a cord or string.
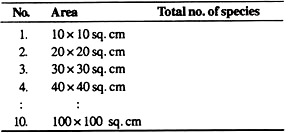
ii. Measure 10 cm on one side of the arm L and the same on the other side of L, and prepare 10 x 10 sq. cm area using another set of nails and string. Note the number of species in this area of 10 x 10 sq. cm.

iii. Increase this area to 20 × 20 sq. cm and note the additional species growing in this area.
iv. Repeat the same procedure for 30 × 30 sq. cm, 40 × 40 sq. cm and so on till 1 × 1 sq. metre area is covered (Fig. 67) and note the number of additional species every time.
Record your data in the following table:
v. Prepare a graph using the data recorded in the above table. Size of the quadrats is plotted on X- axis and the number of species on Y-axis (Fig. 67 B).
Observations:
The curve starts flattening or shows only a steady increase (Fig. 67 B) at one point in the graph.
The point of the graph, at which the curve starts flattening or shows only a steady or gradual increase, indicates the minimum size or minimum area of the quadrat suitable for study.
2. Aim of the Experiment:
To study communities by quadrat method and to determine % Frequency, Density and Abundance.
Metre scale, string, four nails or quadrat, notebook.
(i) Frequency:
Frequency is the number of sampling units or quadrats in which a given species occurs.
Percentage frequency (%F) can be estimated by the following formula:
In Table 4.1, % frequency, density and abundance of Cyperus have been determined. Readings of the other six plants, occurred in the quadrats studied, are also filled in the table. Calculate the frequency, density and abundance of these six plants for practice. (For the practical class take your own readings. The readings in Table 4.1 are only to give an explanation of the matter).
See Table 4.1.
Calculate the frequency, density and abundance of all the plant species with the help of the formulae given earlier and note the following results:
(i) In terms of % Frequency (F), the field is being dominated by…
(ii) In terms of Density (D), the field is being dominated by…
(iii) In terms of Abundance (A), the field is being dominated by…
Table 4.1: Size of quadrat: 50cm × 50cm = 2500 cm 2

iii. Now take a graph paper sheet and plot the number of quadrats on X-axis and the accumulating total number of species on Y-axis of the graph paper.
Observations and results:
A curve would be obtained. Note carefully that this curve also starts flattening. The point at which this curve starts flattening up would give us the minimum number of quadrats required to be laid down in the grassland.
4. Aim of the Experiment:
To study frequency of herbaceous species in grassland and to compare the frequency distribution with Raunkiaer’s standard frequency diagram.
Quadrat, pencil, note-book, graph paper.
i. Lay 10 quadrats in the given area and calculate the percentage frequency of different plant species by the method and formula given above in Exercise No. 2.
ii. Arrange your data in the form of following Table 4.3:

Raunkiaer (1934) classified the species in a community into following five classes as shown in Table 4.4:

Arrange percentage frequency of different species of the above Table 4.3 in the five frequency classes (A-E) as formulated by Raunkiaer (1934) in Table 4.4.
Draw a histogram (Fig. 70) with the percentage of total number of species plotted on Y-axis and the frequency classes (A-E) on X-axis.
This is the frequency diagram (Fig. 70):

The histogram takes a “J- shaped” curve as suggested by Raunkiaer (1934), and this shows the normal distribution of frequency percentage. If the vegetation in the area is uniform, class ‘E’ is always larger than class ‘D’. And in case class ‘E’ is smaller than class ‘D, the community or vegetation in the area shows considerable disturbance.
5. Aim of the Experiment :
To estimate Importance Value Index for grassland species on the basis of relative frequency, relative density and relative dominance in protected and grazed grassland.
Wooden quadrat of 1×1 metre, pencil, notebook.
What is Importance Value Index?
The Importance Value Index (IVI) shows the complete or overall picture of ecological importance of the species in a community. Community structure study is made by studying frequency, density, abundance and basal cover of species. But these data do not provide an overall picture of importance of a species, e.g., frequency gives us an idea about dispersion of a species in the area but does not give any idea about its number or the area covered.
Density gives the numerical strength and nothing about the spread or cover. A total picture of the ecological importance of a species in a community is obtained by IVI. For finding IVI, the percentage values of relative frequency, relative density and relative dominance are added together, and this value out of 300 is called Importance Value Index or IVI of a species.
Relative frequency (RF) of a species is calculated by the following formula:
Point-frame apparatus, graph paper sheet, herbarium sheet, cello tape, note-book.
Point-frame apparatus:
A point-frame apparatus is a simple wooden frame of about 50 cm long and 50 cm high in which 10 movable pins are inserted at 45° angle. Each movable pin is about 50 cm long.
i. Put the point-frame apparatus (with 10 pins) at a place in the vegetation of grassland (Fig. 71) and note down various plant species hit by one or more of 10 pins of the apparatus. Treat this as one sampling unit.
ii. Now put the apparatus at random at 10-25 or more places and note down each time the various plants species in a similar fashion. In case three plants of any species touch three pins in one sampling unit put at a place, the numerical strength of that particular species in this sampling unit will be three individuals. Write this value against the species below this sampling unit.
Note down the details in the form of following Table 4.5:

Record your data in the following Table 4.6 in the form of the following manner:

Table 4.6 gives the complete list of plants occurring in the selected grassland. Also find out the name of the species represented in maximum number in each locality.
These data will also provide a clear picture of the dominant species of the grassland in a particular area.
2. Experiment on Biomass Study: (2 Experiments)
What is Biomass?
It is usually expressed as dry weight of all the living materials (plants as w ell as animals) in an area. Under biomass we include plants (their aboveground and underground parts) as well as animals. Fallen leaves and twigs of the plants are also taken in consideration at the time of studying biomass.
In the forests, the humus is in different stages of decomposition. The floor of the forest remains covered by organic matter which is slightly or not at all decomposed. This is called litter. A partially decomposed matter is present below this layer. It is called duff. Further decomposed matter, which has lost its original form, is present below duff and called leaf mould.
9. Aim of the Experiment:
To measure the above-ground plant biomass in a grassland.
To determine the biomass of a particular area.
Nails (4), metre scale, string, khurpa (a weeding instrument), polythene bags, oven.
i. Make a quadrat of the size of 50 cm × 50 cm in the field by digging the nails and connecting them with the string. Weed out all the above-ground parts of the plants growing in that limit with the help of weeding instrument. Collect all of them in a polythene bag.
ii. Collect the fallen leaves and other parts of the plants in the second polythene bag.
iii. Collect all the animals such as ants, larvae, earthworms, insects, etc., in the third polythene bag.
iv. By digging the soil to about 20 to 25 cm., take out all the underground parts of the plants and collect them in a separate bag after washing.
In the same way lay some more quadrats in the area under study and collect all the materials in polythene bags.
Calculations:
Dry weight of aboveground parts = 15 gm.
Dry weight of underground parts = 4 gm.
Dry weight of animals = 1 gm.
. . . Total dry weight = 20 gm.
50 × 50 cm field area contains = 20 gm. total dry biomass
. . . 100 × 100 cm field area will contain
20×100×100/50×50 = 80gm
80 gm. is the biomass of 100 × 100 cm. field area.
Results of Different Parts:
(i) 50 x 50 cm. field area contains 15 gm. of aboveground parts.
100 × 100 cm. field area will contain
= 15×100×100/50×50 = 60 gm. biomass.
(ii) 50 x 50 cm. field area contains 4 gm. of underground parts.
= 4×100×100/50×50 = 16 gm. biomass
(iii) 50 × 50 cm. field area contains 1 gm. of animals
1×100×100/50×50 = 4 gm. biomass.
One square metre (100×100 cm.) field area contains 80 gm. biomass in terms of dry weight of the total plant and animal parts.
10. Aim of the Experiment :
To determine diversity indices (richness, Simpson, Shannon-Wiener) in grazed and protected grassland.
To study species diversity (richness and evenness), Index of dominance, Similarity index, Dissimilarity index and Species diversity index in grazed and protected grassland.
Khurpa, note book, pen.
Method and results:
(a) Species diversity:
Species diversity is a statistical abstraction with two components.
These two components are:
(i) Richness (or number of species), and
(ii) Evenness or equitability.
In any grassland, to be studied, if there are seventy species in a stand, then its richness is seventy. Pick out individual plants of different species with the help of khurpa, count the number of species in a stand of the area provided, and calculate the richness. On the other hand, if all the species in the grassland have equal number of individuals, then its evenness or equitability is high and if some species have only a few individuals then the evenness is low.
(b) Index of dominance:
The species which have strongest control over energy flow and environment in given habitat are called ecological dominant. According to Simpson (1949), the Index of dominance (C) is calculated by the formula
C= ∑ (ni/N) 2
where∑ (sigma) refers to summation, ni refers to the importance value of the species in terms of number of individuals or biomass or productivity of each species over a unit area, and N refers to the total of corresponding importance values of all the component species in the same unit area and period. Count the Index of Dominance by the above-mentioned formula.
(c) Similarity index:
Similarity Index between two stands of vegetation can be worked out by the formula S = 2 C/(A+B), where S is the Similarity Index, C is the number of species common to both the stands, and A and B are number of species on stand A and stand B. For example, if there are 20 species on site A and 20 on site B and 14 species are common in both sites, the Similarity Index (S) will be;
S = 28/40 or S = 0.7.
(d) Dissimilarity index:
The Dissimilarity Index is counted by the formula D = 1 – S, where D is the dissimilarity index and S is the similarity index. For example, if there are 20 species on site A and 20 species on site B and 14 species are common in both sites the similarity index (S) comes to 0.7 as calculated above in case of similarity index. Therefore, dissimilarity index (D) can be counted, as
D= 1-S or D= 1-0.7 = 0.3.
(e) Diversity index:
Species diversity index (d) is calculated by the following formula given by Menhinick (1964):
where d = diversity index, S = number of species, and N= number of individuals of that particular species.
3. Experiment on Soil Science : (1 Experiment)
11. Aim of the Experiment:
To study the characteristics of different types of soils.
Samples of different types of soils (e.g., clay soil, sand or alluvial soil, humus, black soil, yellow soil, red soil, laterite or lateritic soil).
Method and observations:
Different soil samples are taken and studied individually.
Some of their major characteristics are under mentioned:
I. Clay soil:
i. It is a compact and heavy-textured soil.
ii. The size of its particles is less than 0.002 mm.
iii. It has very minute spaces in between its particles.
iv. It is quite sticky when wet but becomes hard and develops cracks on drying.
v. It has higher water-holding capacity and poor aeration.
vi. It gets waterlogged easily.
vii. Its particles are negatively charged and have the ability to absorb cations of Mg, Ca, K, P, Fe and Na.
viii. This soil is made up of hydrated alumino silicate.
ix. It is quite rich in calcium carbonate and magnesium carbonate.
x. The pore space between its particles is greater than sand.
xi. This soil has high degree of fertility.
Identification:
On the basis of above characteristics, the given sample belongs to clay soil.
II. Fine sand or alluvial soil:
i. This soil is loose, light-textured and silver-grey in colour.
ii. The size of its particles is between 0.02 mm to 0.2 mm.
iii. It has poor water-holding capacity.
iv. This soil shows quite rapid rate of water infiltration.
v. It is poor in humus.
vi. The carbonate content of this soil is very low.
vii. It does not get waterlogged easily.
viii. It shows good aeration.
ix. It is non-sticky and non-plastic when wet.
x. It has very low contents of phosphate, nitrogen and organic matter.
xi. It has shiny particles of aluminium silicate or mica.
xii. Some amounts of iron, magnesium, sodium, aluminium, silicon and calcium are present in this soil.
xiii. Its particles become warm on long exposure to the sun.
The above characteristics show that the given soil sample belongs to fine sand or alluvial soil.
III. Humus:
i. It is decomposed matter of plant and animal remains.
ii. This organic matter is amorphous and dark brown to black in colour.
iii. It is soluble in dilute alkali solution like KOH and NaOH but insoluble in water.
iv. It is actually a layer of organic matter at the top of a soil profile. It is the habitat of most decomposers. The main decomposers are bacteria and fungi.
v. It is made up of nitrogen-rich proteins, lignin and polysaccharides.
vi. A large amount of carbon and small amounts of sulphur, phosphorus and some other elements are also present.
vii. It is colloidal in nature.
On the basis of the above characteristics, it can be concluded that the given material is humus.
IV. Black soil:
i. This is black-coloured soil. The black colour is due to the presence of iron in this soil.
ii. High percentage of iron oxides, calcium carbonates, magnesium carbonates and alumina are present in this soil.
iii. It also contains large amount of nitrogen and organic matter. It, however, contains very low amount of phosphorus.
iv. If made wet by adding some water, this soil is sticky. On drying, it contracts and shows cracks.
v. It has high water-retaining capacity.
vi. It is highly productive and suits most for the crops like cotton.
Based on the above-mentioned characteristics, it can be concluded that the given sample belongs to black soil.
V. Yellow soil:
i. The yellow colour of this soil is due to the enhanced hydration of ferric oxide.
ii. It is a porous soil with nearly neutral pH.
iii. Size of the particles of this soil is between 0.002 mm to 0.02 mm.
iv. It is a granite-derived soil with moderately rich humus.
v. It contains very low amount of oxides of phosphorus, nitrogen and potassium.
vi. It contains large amount of silicon oxide and alminosilicate.
The above characteristics show that this is a sample of yellow soil.
VI. Red soil:
i. This is the sample of red-coloured soil.
ii. The red colour is due to the diffusion of large amount of iron compounds such as ferrous oxide and ferric oxide.
iii. It is a slightly acidic type of soil. Its pH varies between 5 and 8.
iv. Some amount of silicon oxide and aluminium oxide are also present in this soil.
v. This soil is not good for agriculture because it is poor in nitrogen, phosphorus and humus.
Because of the above characteristics, the given sample is of red soil.
VII. Laterite soil:
i. This is yellowish or red-coloured soil. On exposure to sun it turns black.
ii. It is produced from aluminium-rich rocks.
iii. It is quite compact type of soil made up of hydrated oxides of iron and aluminium.
iv. It also contains small amounts of compounds like magnesium oxide and titanium oxide.
v. Small amounts of nitrogen, phosphorus, magnesium, potash and lime are also present in this soil.
vi. It is also quite rich in humus.
vii. Because of the above characteristics, this soil is good for the purpose of agriculture.
Above-mentioned characteristics show that the given sample is of laterite or lateritic soil.
4. Experiment on Aquatic Ecosystem: (1 Experiment)
What is ecosystem?
Living organisms are structurally and functionally inter-related with the external world or the environment, and this functional and structural relationship of communities and the environment is called ecological system or ecosystem.
Ecosystem normally contains:
(i) Biotic components and
(ii) Abiotic components.
Taking in view the organisms and their habitat conditions, the ecosystem can be classified as follows:
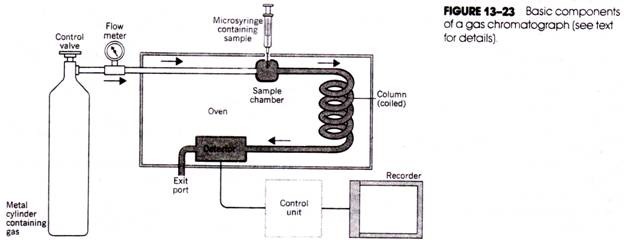
Pond ecosystem can be studied as follows:

12. Aim of the Experiment :
To study the biotic components of a pond. Make diagram of a pond ecosystem.
Hand lens, collection net, meshes of different sizes, collection tubes, iron hook, scissor, forceps, and centrifuge.
Biotic components of a pond can be studied exactly according to the classification of a pond ecosystem given above. Hydrophytes can be picked by hand and collected in polythene bags. Other submerged plants may also be taken out by iron hooks (Fig. 74).

Phytoplankton and zooplankton can be collected in plankton bottles.
With the help of plankton nets, microorganisms can be collected in tubes.
Macro-producers and macro-consumers can be estimated in gm./cubic metre by the quadrat method used in the exercise of biomass.
Micro-producers and micro-consumers can be estimated in gm./litre of water collected as sample from an undisturbed part of the pond. They can be separated by centrifuging a little amount of pond water (containing micro-producers and micro-consumers) in test tube.
On the basis of their trophic position in the ecosystem different organisms may be grouped as follows:
(a) Producers:
(i) Submerged:
Vallisneria, Ceratophyllum, Hydrilla, Potamogeton, Chara, etc.
(ii) Free-floating:
Azolla, Eichhornia, Lemna, Pistia, Spirodella, Salvinia, etc.
(iii) Rooted floating:
Trapa, Jussiaea, Nymphaea, Potamogeton, Nelumbium, etc.
(iv) Rooted Amphibious:
Marsilea, Typha, Ranunculus, Polygonum, Cyperus, etc.
(v) Phytoplankton:
Agal members of Chlorophyceae, Xanthophyceae, Bacillariophyceae, Myxophyceae, etc.
(b) Consumers:
(i) Consumers of the 1st order (Primary consumers):
e.g., Zooplankton, some insects.
(ii) Consumers of the 2nd order (Secondary consumers):
e.g., Fishes, frogs and some insects.
(iii) Consumers of the 3rd order (Tertiary consumers):
e.g., Birds, big fishes, etc.
(c) Decomposers:
Fungi and bacteria.
5. Experiment on Physico-Chemical Analysis of Water : (7 Experiments)
13. Aim of the Experiment:
To measure temperature and pH of different water bodies.
Maximum-minimum thermometer or thermometer or thermo flask.
(i) Temperature:
The temperature of the pond can be determined by any of the following apparatuses:
(a) Maximum-minimum thermometer:
It contains two indicators (Fig. 73). With the help of a magnet these indicators are set to the present atmospheric temperature. Quickly lower down the thermometer to the desired depth in the pond. Keep it there for 10 minutes.
Bring out the thermometer quickly and note the readings of both the indicators. Out of the two indicators, one remains at the point and other moves to some extent giving the reading of temperature at that particular depth of the pond.
(b) Thermistor:
It is an instrument which gives correct reading of temperature in centigrade. It contains a long cable. At the end of the cable is attached a thermocouple (Fig. 75).

A milliammeter is present which is calibrated in C° and gives direct reading. Quickly lower the thermocouple upto a desired depth and note the temperature.
(c) Thermo flask:
It is also one of the good apparatuses for measuring the temperature of a pond. After lowering to the desired depth, bring it out when it is filled completely with water. With the help of a good sensitive thermometer, note the temperature of the water.
pH of the pond water can be tested by pH meter, pH paper or B.D.H. Universal Indicator.
14. Aim of the Experiment:
To determine transparency or turbidity of different water bodies.
Transparency (clarity of pond):
It is directly related to and mainly depends upon the presence of microorganisms and microscopic soil particles in the pond water. If the quantity of soil particles and microscopic organisms will be more, the pond water will be less transparent. It also depends upon the depth of the pond water. The turbidity value will be very low in the deep water.
The instrument for knowing the turbidity value is called Secchi disc (Fig. 76). It is a circular disc with black and white or other contrasting colours. The disc is lowered down in the water. Note the depth of the water where there is no colour contrast on the disc.

15. Aim of the Experiment:
To find out the light intensity available to pond.
Light intensity:
Light intensity available to the pond is measured with the help of ‘photometer’ (Fig. 77).

A ‘photometer’ consists of a photoelectric cell and a micro-ammeter. Photometer for pond is specially sealed in water-tight containers fitted with a glass window. Photoelectric cell is sensitive to light and generates current when light falls on it. Light intensity is proportional to the current generated in the photoelectric cell by the light falling on it. Readings can be noted in micro-ammeter.
Calculate the light intensity by the following formula:
Light Intensity = r × 100 / a
where r – Reading of lux-meter or photometer
a = Reflected light from the cardboard.
16. Aim of the Experiment:
To measure amount of dissolved oxygen content in polluted and unpolluted water bodies.
To measure amount of dissolved oxygen in pond water.
Water sample, glass stoppered conical flask, manganous-sulphate, potassium iodide solution (alkaline), pipettes, sulphuric acid (conc.), sodium thiosulphate solution, starch solution, reagent bottles.
Preparation of reagents:
(a) Starch solution:
Add 1 gm. starch in 100 ml distilled water, warm and dissolve it.
(b) Potassium iodide solution (alkaline):
Heat 200 ml of distilled water and dissolve in it 100 gm. KOH and 50 gm. KI.
(c) Manganous sulphate solution:
Add 200 gmMnSO 4 . 4H 2 O in 200 ml distilled water. Heat it to dissolve maximum salt. Cool it and then filter it.
(d) Sodium shiosulphate solution:
Dissolve 24.82 gmNa 2 SO 4 . 5H 2 O in some amount of distilled water and make up the volume to 1 litre by adding more distilled water. To stabilize the solution add a small pellet of sodium hydroxide. Thus prepared solution is 0.1N stock solution. In 250 ml of this stock solution add 750 ml of distilled water to dilute the solution of sodium thiosulphate.
i. Take 100 ml of water sample in a 250 ml glass-stoppered conical flask and add 1 ml of manganous sulphate solution and 1 ml alkaline potassium iodide solution by separate pipettes. Appearance of brown precipitate indicates the presence of oxygen in the water sample.
ii. Shake it well and then allow the precipitate to settle down.
iii. Add 2 ml sulphuric acid (conc.) and again shake it well. The precipitate will be dissolved.
iv. Decant the liquid and titrate it with sodium thiosulphate solution. Starch solution is used as an indicator. The blue black colour disappears when the end point is reached.
Calculations and results:
Dissolved oxygen in mg/ liter is calculated by the following formula:
Dissolved O 2 (mg/l)
= (ml × N of sodium thiosulphate) × 8 ×1000/V 1 – V 2
where V 1 = Volume of water sample titrated,
V 2 = Volume of MnSO 4 and KI solution added.
17. Aim of the Experiment :
To determine the total dissolved solids (TDS) in water.
Water, sample, evaporating dish, Whatman filter paper, oven, desiccator, balance, beakers.
i. Weigh a dry and clean evaporating dish of200 ml capacity.
ii. Shake the water sample well and filter it through Whatman filter paper.
iii. Take 100 ml of filtrate in a pre-weighed evaporating dish and keep it in an oven at 180°C for some time. The water will be evaporated and the sample will become dry.
iv. Cool it in a desiccator and weigh. Calculate the total dissolved solids using following formula:
Total Dissolved Solids (mg/1) = (a-b) × 10/V
a = Weight of dish and dried filtered sample (in gm.)
b = Weight of empty evaporating dish (in gm).
V= Volume of sample evaporated (in ml).
18. Aim of the Experiment :
To count phytoplankton by haemocytometer method.
Haemocytometer, water sample, cover slip, microscope, dropper.
Haemocytometer is a special type of glass slide having more than 500 small grooved chambers or counting chambers (1 × 1 × 0.5 mm) in the middle portion. This specially designed slide is used for counting the microorganisms or plankton present in a water drop.
i. Take a haemocytometer and put a drop of concentrated water sample on its counting chambers.
ii. Put a cover slip, wait for about 2-5 minutes and examine under the high power of microscope. Count the plankton present in each chamber.
19. Aim of the Experiment:
To determine plankton biomass of a pond.
Pond water, shallow water bottle, chemical balance, oven, beaker, funnel, Whatman filter paper.
i. Collect 1000 ml of surface water of pond with the help of a shallow water bottle. This water contains phytoplankton and zooplankton.
ii. Weigh a dry filter paper. Suppose it is A 1 gm.
iii. Take another filter paper. Make it wet and weigh it. Suppose it is A 2 gm.
iv. Filter the water sample through a Whatman filter paper and weigh this filter paper containing plankton. Suppose it is A 3 gm.
v. Now put this plankton-containing filter paper in oven for 24 hours at 85°C. Weigh this dry filter paper with plankton. Suppose it is A 4 gm.
Calculations and result:
Calculate the biomass (fresh weight or dry weight of organisms) in mg/litre as follows:
(i) Fresh weight of plankton/1000 ml = A 3 – A 2 gm.
(ii) Fresh weight of plankton/ml = A 3 – A 2 gm/1000
(iii) Dry weight of plankton/1000 ml = A 4 – A 1 gm.
(iv) Dry weight of plankton/ml = A 4 – A1/1000 gm.
Related Articles:
- Experiments on Soil | Ecology
- Characteristics of Plant Communities | Ecology
Experiment , Biology , Ecology , Experiments on Ecology
- Anybody can ask a question
- Anybody can answer
- The best answers are voted up and rise to the top
Forum Categories
- Animal Kingdom
- Biodiversity
- Biological Classification
- Biology An Introduction 11
- Biology An Introduction
- Biology in Human Welfare 175
- Biomolecules
- Biotechnology 43
- Body Fluids and Circulation
- Breathing and Exchange of Gases
- Cell- Structure and Function
- Chemical Coordination
- Digestion and Absorption
- Diversity in the Living World 125
- Environmental Issues
- Excretory System
- Flowering Plants
- Food Production
- Genetics and Evolution 110
- Human Health and Diseases
- Human Physiology 242
- Human Reproduction
- Immune System
- Living World
- Locomotion and Movement
- Microbes in Human Welfare
- Mineral Nutrition
- Molecualr Basis of Inheritance
- Neural Coordination
- Organisms and Population
- Photosynthesis
- Plant Growth and Development
- Plant Kingdom
- Plant Physiology 261
- Principles and Processes
- Principles of Inheritance and Variation
- Reproduction 245
- Reproduction in Animals
- Reproduction in Flowering Plants
- Reproduction in Organisms
- Reproductive Health
- Respiration
- Structural Organisation in Animals
- Transport in Plants
- Trending 14
Privacy Overview
Science Fun

Ecology Science Experiments
Ecology science experiments you can do at home! Click on the experiment image or the view experiment link below for each experiment on this page to see the materials needed and procedure. Have fun trying these experiments at home or use them for SCIENCE FAIR PROJECT IDEAS.
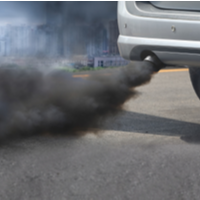
Smog In A Jar:
Explore And Observe Air Pollution
Compost In A Bottle:
Turn Trash Into Fertile Soil
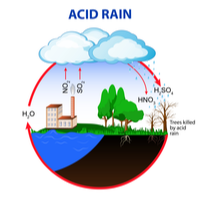
Investigate Pollution And Precipitation

Make A Paper Straw:
Alternatives To One Time Use Plastics

Blossoming Beans:
Germinate a Pinto Bean

Changing of the Leaves:
Alter Green Leaves into Colorful Leaves
Moldy Apples:
What Transforms an Apple into a Moldy One?

Little Birdie Snack Bar:
Create A Snack No Bird Can Resist
School Ecology Practicals
This site lists my favourite ecology practical resources, bringing together resources from other sites.
It's still a work in progress, and some practicals (at the bottom of the page) are just an idea without resources.
🔬 Lab practical
🏞 Outdoor practical
1️⃣ Hours required (if can be done in a single session)
🗓 Takes place over more than one session
🌦 Weather- or season- dependent
Ideas with resources
Acid rain - lab 🔬 🗓.
Make up a 0.005M solution of sulphuric acid ("acid rain") and have students expose a range of objects to it to observe the effects of acid rain.
Student task sheet
Based on this RSC resource .
Air pollution - Lichen 🏞 1️⃣
Lichen are very pollution-sensitive. The 'crusty' forms are the only ones that can grow in high levels of air pollution (such as sulphur oxides). The 'bushy' ones are only found in areas of low pollution.
Teacher notes
Lots more great resources on the British Lichen Society website.
AIR pollution - sulphur dioxide
A simple investigation of the effect of sulphur dioxide on germination.
Student sheet
Further details
Biodiversity - freshwater tanks 🔬 🗓
Collect a handful of aquatic plants from a local freshwater source. Place in a clear container of chlorine-free water on a windowsill and wait for the life to emerge - expect Daphnia , shrimps, springtails etc.
A simple dissecting microscope can help.
The iNaturalist app is a good way to identify species
Biodiversity - soils 🔬🏞 1️⃣
Put soil in a Tullgren funnel and put a hot light source above and a conical flask below. Insects move down and get trapped in the flask.
Soil invertebrate ID guide
BIOMASS & Energy - duckweed & mealworms🔬1️⃣
Find the dry mass of a sample of duckweed then use it to estimate the mass of a larger population.
Use a standard calorimetry technique to find the energy content of a mealworm.
Carbon Cycle - Trees
Calculate the carbon content of a tree.
" There are four steps to calculating the carbon content of a tree
Calculate the volume of the tree trunk
Calculate the biomass of the tree trunk
Estimate the biomass of the canopy and the root ball
Calculate carbon content based on the biomass of the whole tree"
Teacher guide
Ecosystems - Ecocolumns 🔬 🗓
An EcoColumn is designed to model an ecosystem on a small scale , with separate layers within a plastic bottle.
Instructions
Teacher notes and questions
Links to theoretical concepts
Student task
SAPS have an ecocolumn which uses carnivorous plants .
Habitats - Choice chambers 🔬 🗓 1️⃣
Give invertebrates (e.g. maggots) a choice of different conditions and see which they prefer.
Teacher and student notes
This is a required practical for AQA A Level Biology, so there are a huge number of other resources available.
Habitats - Earthworms 🏞 1️⃣
Analysing soil properties and then digging a soil pit to identifying the earthworm species present.
Teacher and student resources
HEAVY MEtals - virtual transect🔬🗓
Presentation
Virtual transect
Infiltration 🏞 1️⃣
How to measure infiltration of water into soil.
Natural Selection - Pigeons
Record the number of pigeons of each pattern type and compare this to previous studies, drawing tentative conclusions about possible selective advantage.
Worksheet (do first two pages, then get data, then do the rest)
Pigeon tally chart (video pigeons and then pause video to count)
Imperfect graphs (add data and improve graphs)
Nitrogen cycle - fishtanks / ecospheres 🔬 🗓
Establish a fish tank or ecosphere and monitor metrics of biodiversity and nitrogen-compound concentration.
Ocean Acidification
Ocean acidification in a cup
Phytoremediation 🔬 🗓
Brown mustard plants are grown in dilute copper sulphate, reducing the copper content of the solution.
Teacher and student notes at SAPS
Population sizes - pitfall traps 🏞 🗓
Dig pitfall traps and trap invertebrates. Mark and recapture to estimate population sizes.
Video for pitfall traps
Video for mark-recapture
INdicator species - pond dipping 🏞 1️⃣
Use a pond dipping technique to identify species present and thereby determine water quality. There are loads of resources available for this, and I have found it hard to narrow it down. My favourites are probably:
FSC ID guide with biotic index calculator
Wildlife Trust Trust ID guide with biotic index calculator
Practical Biology teacher notes and student sheet
Soil Erosion
Instruction sheet
Succession - manipulation 🏞 🗓
Establish a 2m ² grid on the school grounds. Divide it into four 1m ² squares. Clear all vegetation down to soil. Leave one square a year and then re-clear - leave the others undisturbed. Clear the second square in year two. Repeat clockwise over the years so you end up with four squares where there is always one that has been undisturbed for four years, one left for three, one for two and one for one year.
Particulates 🏞 🗓
Add vaseline to cards and hang up. Look for particulates under a microscope and compare levels in different areas.
productivity - Elodea 🔬 🗓
Compare oxygen production of Elodea sp in light and dark, then use to calculate R, GPP and NPP.
IDEAS WITHOUT RESOURCES
Acid rain: Grow soil fungi on agar of different pH levels.
Biodiversity: kick sampling in rivers
Population sizes - moth traps (Trap moths overnight using a moth trap, then mark and recapture to estimate population size.)
Population sizes - snails (Mark-release-recapture snails)
Compeition in plants (Grow radishes or other fast-growing species at a variety of densities and observe effects on growth.)
Succession (observation)
Productivity - stick insects
Measure growth, faecal loss, and food eaten of stick insects and use this to calculate GPP, NPP and R.
Zonation/transects - light intensity (In the spring, before deciduous trees have their leaves, herbaceous plants grow in the dappled shade beneath trees. In bright sunlight, they are outcompeted by grasses. A transect line or stratified random sampling can reveal this. )
Acid rain - fungal growth 🔬 🗓
Grow soil fungi on agar of different pH levels.
Biodiversity - Kick Sampling in Rivers 🏞 1️⃣
Population sizes - moth traps 🏞 🗓.
Trap moths overnight using a moth trap, then mark and recapture to estimate population size.
Competition - Yeast 🔬1️⃣
In a smaller container, yeast will compete more for oxygen and decolourise methylene blue less quickly.
Trying to remember where I've seen this. Something like the ISA that was about temperature .
Competition - plants 🔬 🗓
Grow radishes or other fast-growing species at a variety of densities and observe effects on growth.
Soil Compaction 🏞 1️⃣
Use knitting needs to measure soil compaction.
See ' measuring soil hardness ' for instructions
Succession - observation 🏞 1️⃣
Productivity - stick insects 🔬 🗓, zonation / transects - light intensity 🏞 1️⃣ 🌦.
In the spring, before deciduous trees have their leaves, herbaceous plants grow in the dappled shade beneath trees. In bright sunlight, they are outcompeted by grasses. A transect line or stratified random sampling can reveal this.
Want to come up with ideas of your own? Try the random generator!
- Skip to primary navigation
- Skip to main content
- Skip to primary sidebar
Teaching Expertise
- Classroom Ideas
- Teacher’s Life
- Deals & Shopping
- Privacy Policy
20 Fun-Filled Ecological Activity Ideas
March 28, 2023 // by Ashley Pickens
We will explore 20 ecological activities that can be carried out in a classroom or homeschool setting. From simple experiments to outdoor explorations, creative projects, and interactive games, these activities will teach students about energy conservation, waste reduction, water conservation, and sustainable living. By participating in these activities, students will become advocates for the environment; playing an active role in creating a better future for themselves and the planet.

1. Arctic Climate Activity
By studying polar bears’ adaptations to the Arctic climate, students will learn how animals adapt and survive in extreme environments. This is an ideal activity in children’s stations as they can build models, answer open-ended questions, draw, and graph.
Learn More: National Wildlife Federation
2. Environment Cleanup

Hosting a coastal/community-level cleanup with students can help raise awareness of the impact of pollution on marine life and wildlife. Children will learn about the importance of reducing waste and recycling. The primary outcome is that students will develop a sense of environmental responsibility.
Learn More: Ocean Conservancy
3. Research Environmental Science Careers

Researching environmental science career paths can help students explore the diverse range of available opportunities. They can discover roles in conservation, renewable energy, sustainability, public health, the U.S. Department of Health and Human Services, and more.
Learn More: Environmental Science
4. Recycling Game
An interactive recycling game can teach students the importance of reducing waste and recycling. It provides a fun way for students to learn about different types of waste and how to properly dispose of them and reinforce the importance of environmental responsibility.
Learn More: Environmental Protection Agency
5. Living Things Lesson

Learning about the river otter can help students understand animal behavior, physical activity levels, and characteristics of living things. Students can explore their habitat, diet, and adaptations to survive in the wild.
Learn More: Aquarium of the Bay
6. Flower Reproductions Labs
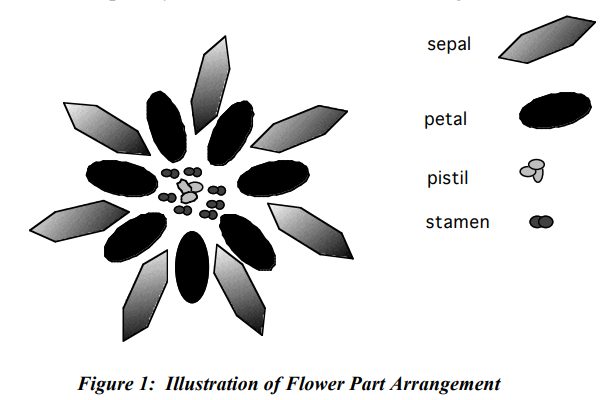
These 4 lab activities, related to flower reproduction, can help students understand the different parts of a flower using detailed descriptions, how they contribute to reproduction and their significance in the ecosystem. Activities include the dissection of flowers, observing pollinators, construction of 3D models, and pollen germination.
Learn More: Cornell University
7. Fun Ecosystem Video
This video highlights the essential components of an ecosystem and explains how living organisms play a crucial role in maintaining balance within it. It emphasizes the concept of a niche and how each organism’s unique characteristics enable it to contribute to the greater ecosystem.
Learn More: Peekaboo Kidz
8. All About Composting
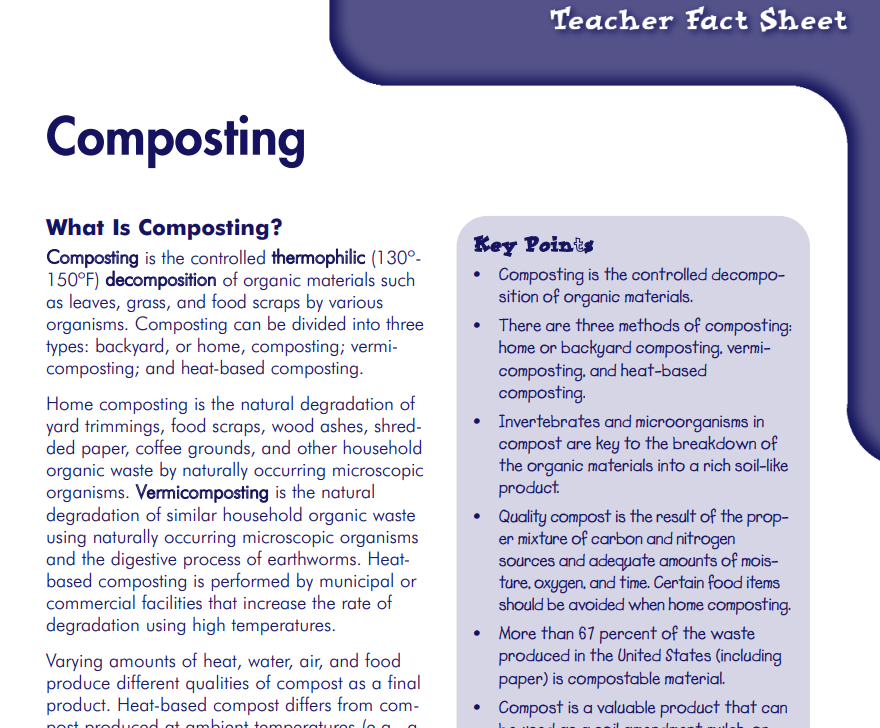
This printable provides an introduction to composting; including its benefits, how to get started, the different types of materials that can be composted, and how to maintain a healthy compost pile.
Learn More: Teacher Vision
9. Minecraft Ecology

This game and worksheet combo explore biodiversity through five threatened species biomes. The impact of human activity on these biomes and the importance of biodiversity are highlighted.
Learn More: Minecraft Education
10. Virtual Field Trip
A virtual field trip through the Amazon rainforest offers an opportunity for students to learn about relationships between living organisms and their environment and explore diverse plant and animal life in the Amazon.
Learn More: National Geographic Education
11. Digital Food Chains
Students will use laptops to create eight forest food chains by dragging and dropping plants and animals into the appropriate sequences. This interactive activity promotes an increase in children’s understanding of the interconnectedness of different species in a forest ecosystem. It highlights the importance of each species in maintaining the food chain.
Learn More: Teachers Pay Teachers
12. Explore 4 Habitats
In this video, students will explore the diverse habitats around the world; including tundra, grasslands, forests, and water. They will learn about the unique characteristics of each habitat, the plants and animals that live there, and the environmental factors that shape the ecosystem and the world’s biodiversity.
Learn More: Harmony Square
13. Ecology Song
In this video, a teacher uses music to teach about ecology. The song covers a variety of ecology topics- making learning fun and engaging while promoting the retention of information during study periods or even outdoor playtime.
Learn More: ParrMr
14. Role-Playing Activity

Change sedentary time into physical activities! In a role-playing lesson about beavers and ecosystem management, students take on different roles to explore the impact of beavers on their ecosystems. They’ll learn about the positive and negative effects of beaver activity on their habitat.
Learn More: Science Journal for Kids
15. Biotic vs. Abiotic Factors
In this scavenger hunt, students will learn to define and identify abiotic and biotic factors in their community. A good proportion of time will be spent exploring the great outdoors to examine their environment’s physical and biological components and how they interact with each other.
Learn More: University of Houston
16. Impacts on Moose Populations
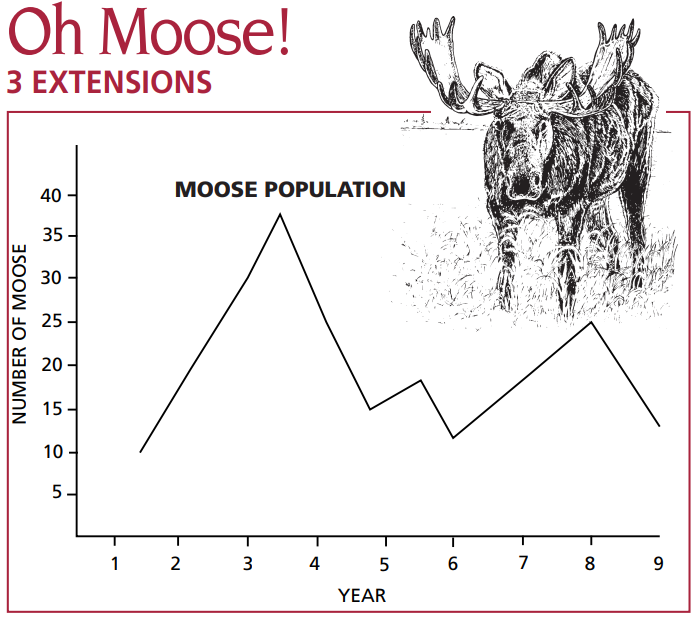
Students will play a game that demonstrates how populations change in response to the availability of resources such as food, water, shelter, and the environmental factors impacting population growth and decline. They can continue with future studies to learn about conversation and health promotion programs for wildlife.
Learn More: Alaska.gov
17. DIY Terrarium

Creating a DIY terrarium allows students to explore the workings of an ecosystem in a closed environment and learn about the relationships between different organisms and the importance of maintaining a delicate balance within an ecosystem.
Learn More: Generation Genius
18. Migratory Birds Lesson
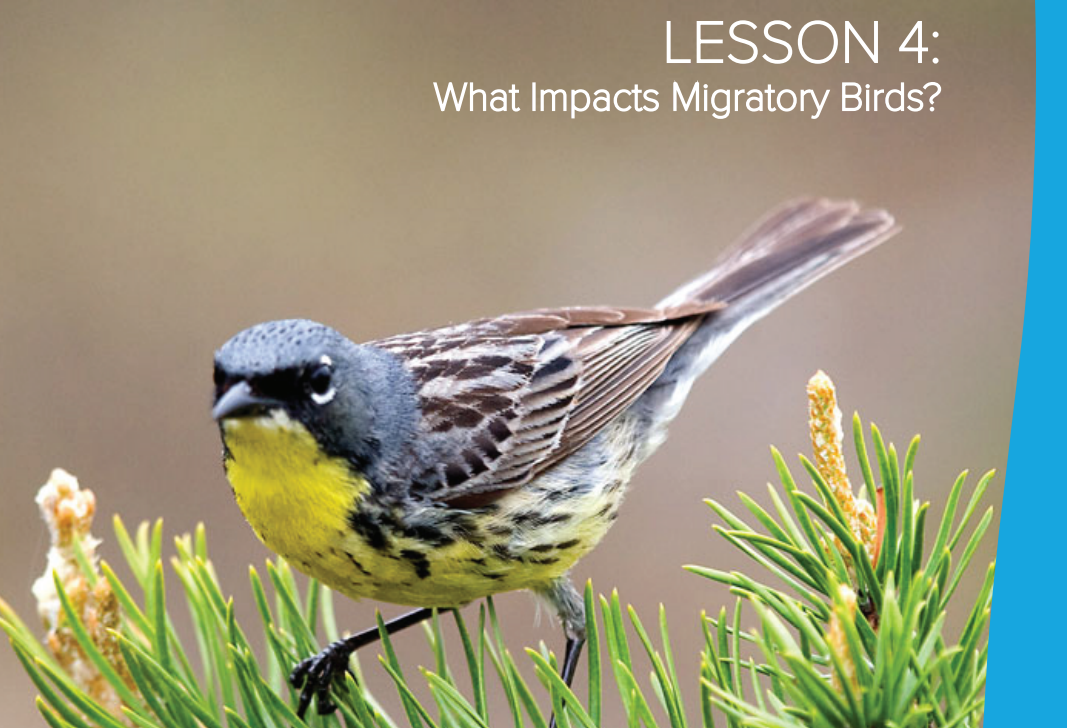
Students will construct a model that illustrates the effects of various factors on the population of Kirtland’s warbler. This hands-on activity helps students understand the causes of population decline and emphasizes conservation initiatives to safeguard endangered species.
Learn More: National Zoo
19. Pollinators in Garden Habitats
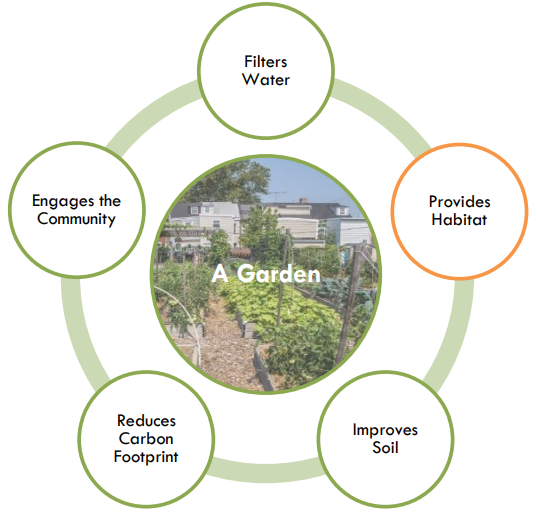
Students will conduct a species census in a garden habitat; observing the interactions between species, especially pollinators. Through data collection and systemic review, they can identify species, study their relationships, and the factors affecting them, as they track and discover patterns in biodiversity linked to changes in the garden habitat.
Learn More: Nature.org
20. Let’s Get Recycling

Physical activities are so much fun! Students will collect and sort different household recycled items to display on a poster. This hands-on approach will help students understand the importance of recycling, how to sort items properly, and the different types of materials that can be recycled.
Learn More: Education
Search Filters:
Main Navigation
Search Cornell
Cornell Institute for Biology Teachers
- Labs & Activities
- Workshops & Events
- Equipment Lending Library
- Connect with Cornell
Labs & Activities
Browse labs & activities:.
- 2012 CIBT Alumni Workshop (19)
- Animals (18)
- Ecology (25)
- Elementary School (12)
- Evolution (10)
- Forensics (3)
- Genetics (7)
- High School (49)
- Human Health (11)
- Inquiry/Scientific Method (30)
- Insects (7)
- Microbiology (12)
- Middle School (32)
- Molecular Biology (12)
- Physical Sciences (10)
- Physiology (10)
- Plants (19)
- Recently Updated! (6)

Abuse-a-Cyst- University of Utah
2012 cibt alumni workshop, high school, inquiry/scientific method, middle school.
Brine shrimp populations survive in some of the harshest environments. Subject brine shrimp cysts to extreme conditions then try to hatch them to see just how tough they are! Downloads Abuse a Cyst Lab (University of Utah)
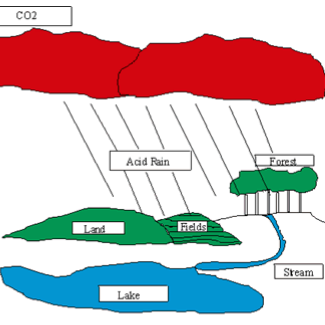
Acid Rain Lab- Katherine Betrus Derrico
Students will design and conduct an experiment to test the effect of acid rain on the germination of seeds. They will utilize the data from their experiment to explain their conclusions, and also read a passage on acid rain. Downloads Acid Rain Lab Rubric (Katherine Betrus Derrico) Acid Rain Lab… read more of the article entitled “Acid Rain Lab- Katherine Betrus Derrico”
Battle-jar Galactica- Matt Downing
Microbiology.
In this investigation students will study the types of bacteria that grow during the formation of sauerkraut, identify some characteristics of each, as well as research the type of respiratory pathway used by the organisms to break down the cabbage to get their energy. Downloads pH Questions (Matt Downing) Bacteria… read more of the article entitled “Battle-jar Galactica- Matt Downing”
Biomagnification Lab- Todd Shuskey
This lab demonstrates how contaminants can accumulate in organisms within a food web by using paper cutouts and M&M®s candies to simulate fish, osprey, and DDT. Students can see how the contamination levels increase as the trophic level increases. Downloads Biomagnification Lab Pictures (in color) Biomagnification Lab Pictures (in black and… read more of the article entitled “Biomagnification Lab- Todd Shuskey”
Bottle Ecosystem- Tim Downs
Physical sciences.
The objective of this lab is to put together a suitable habitat (ecosystem) that will allow one or two guppies to survive to the end of the school year and beyond. Students will make observations of their ecosystems for the three weeks. The ecosystem in this experiment will be closed,… read more of the article entitled “Bottle Ecosystem- Tim Downs”
Bouquet of Flowers
Recently updated.
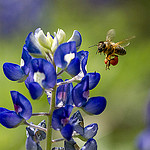
This series of four different lab activities all relate to flower reproduction. They have been designed to relate to each other and to stand alone. Name that Pollinator focuses on adaptations for successful pollination. Both pollen and pollen vectors are examined. Observing, data gathering, making measurements through the microscope, and… read more of the article entitled “Bouquet of Flowers”

Comparative Skulls
What can a skull tell you? A lot! If you look at a skull for clues about its origin, not only can you identify what species it might be from, but you can learn many details about the original animal. In this lab, students will determine what clues to analyze in… read more of the article entitled “Comparative Skulls”
Comparing Aquatic Communities
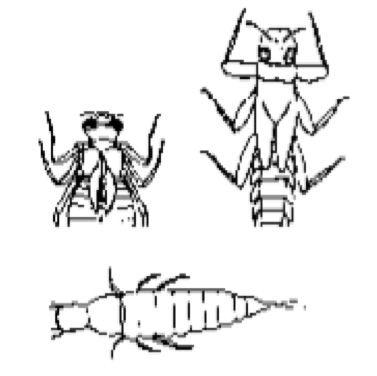
Teams of students measure physical and chemical characteristics of different sites in streams and/or ponds and collect benthic invertebrate organisms. They interpret patterns in the structure of the biological community at each site in light of the abiotic (physical and chemical) and biotic nature of the environment. Downloads Comparing Aquatic… read more of the article entitled “Comparing Aquatic Communities”
Edible Earth Parfaits- Groundwater Foundation
Elementary school.
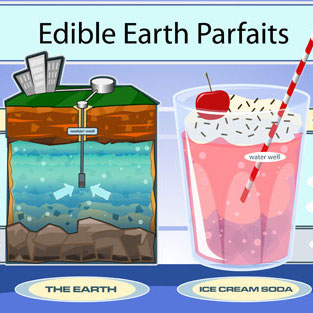
This activity uses soda, ice cream, sprinkles, colored sugars, and food coloring to represent the layers of Earth and aquifers under the surface. Students are instructed to “drill a well” with a straw and “pump the well” by sucking on the straw, as they watch the decline in the water… read more of the article entitled “Edible Earth Parfaits- Groundwater Foundation”
Food Chain Game- Delta Education
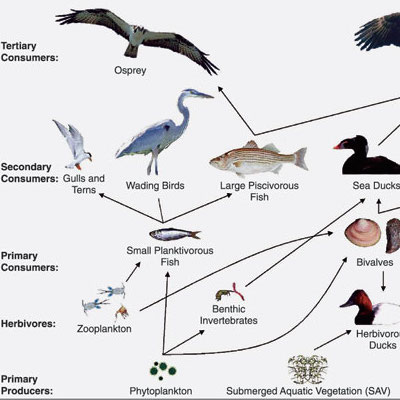
In this activity, students investigate food chains by assuming the roles of animals that are part of a food chain. Downloads
Goldenrod Galls
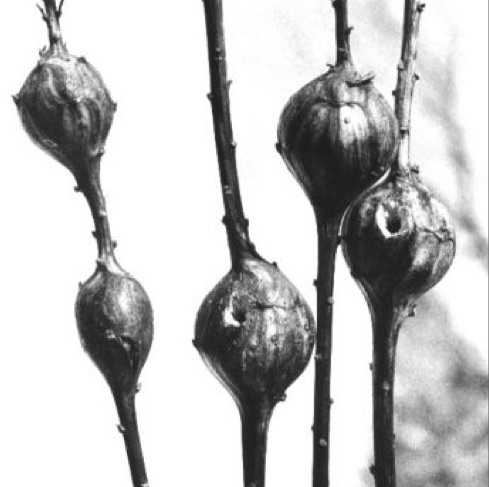
This investigation examines natural selection and coevolution using goldenrod (Solidago canadensis), its stem gall insect (Eurosta solidaginis), and associated parasites, parasitoids, and predators that feed upon the stem gall insect (i.e., Eurytoma obtusiventris, Eurytoma gigantea, Mordellistena unicolor, and birds). Through measurements of gall size and an investigation of events occurring… read more of the article entitled “Goldenrod Galls”
Lichens on Tree Trunks- Scott LaGreca
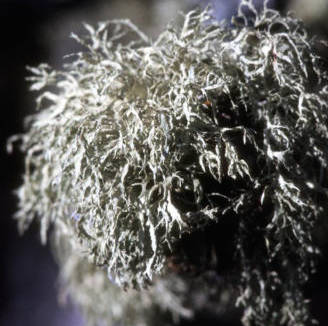
Students will learn to recognize moss and lichens, identify various trees, record observations using a mapping technique, use a compass, and think about the conditions mosses and lichens need to grow. They will identify and mark trees with mosses and lichens growing on their trunks, and try to figure out… read more of the article entitled “Lichens on Tree Trunks- Scott LaGreca”

Mark-Recapture- Nancy Wright
This lab presents a popular method often used to estimate the population size of a single species of highly mobile animals, such as insects or vertebrates. Students use other students in the school as their population and the Lincoln-Peterson method to determine population size. “Real ecologists” also use this method… read more of the article entitled “Mark-Recapture- Nancy Wright”
Medical Importance of Biodiversity- Mary Keymel
Human health.
Students assume the role of an ethnobotanist for a start-up pharmaceutical company, who is about to journey to the rainforest, coral reef, or another natural source of medicine in the world. Their mission is to catalog 1 plant or animal species that may be useful to medical research. They will… read more of the article entitled “Medical Importance of Biodiversity- Mary Keymel”

Mollusk Dichotomous Key
In this lab, students will be introduced to the concept of a dichotomous key through the use of preliminary activities modeled by the teacher. They will then learn about the ecology and biology of selected marine mollusks, before putting their dichotomous key reading skills to the test on 8 or… read more of the article entitled “Mollusk Dichotomous Key”
-->Cornell University --> ©2014 ↑
Ecology Practical 1 – Measuring abundance and random sampling
- Share to Facebook
- Share to Twitter
- Share via Email
Age Ranges:
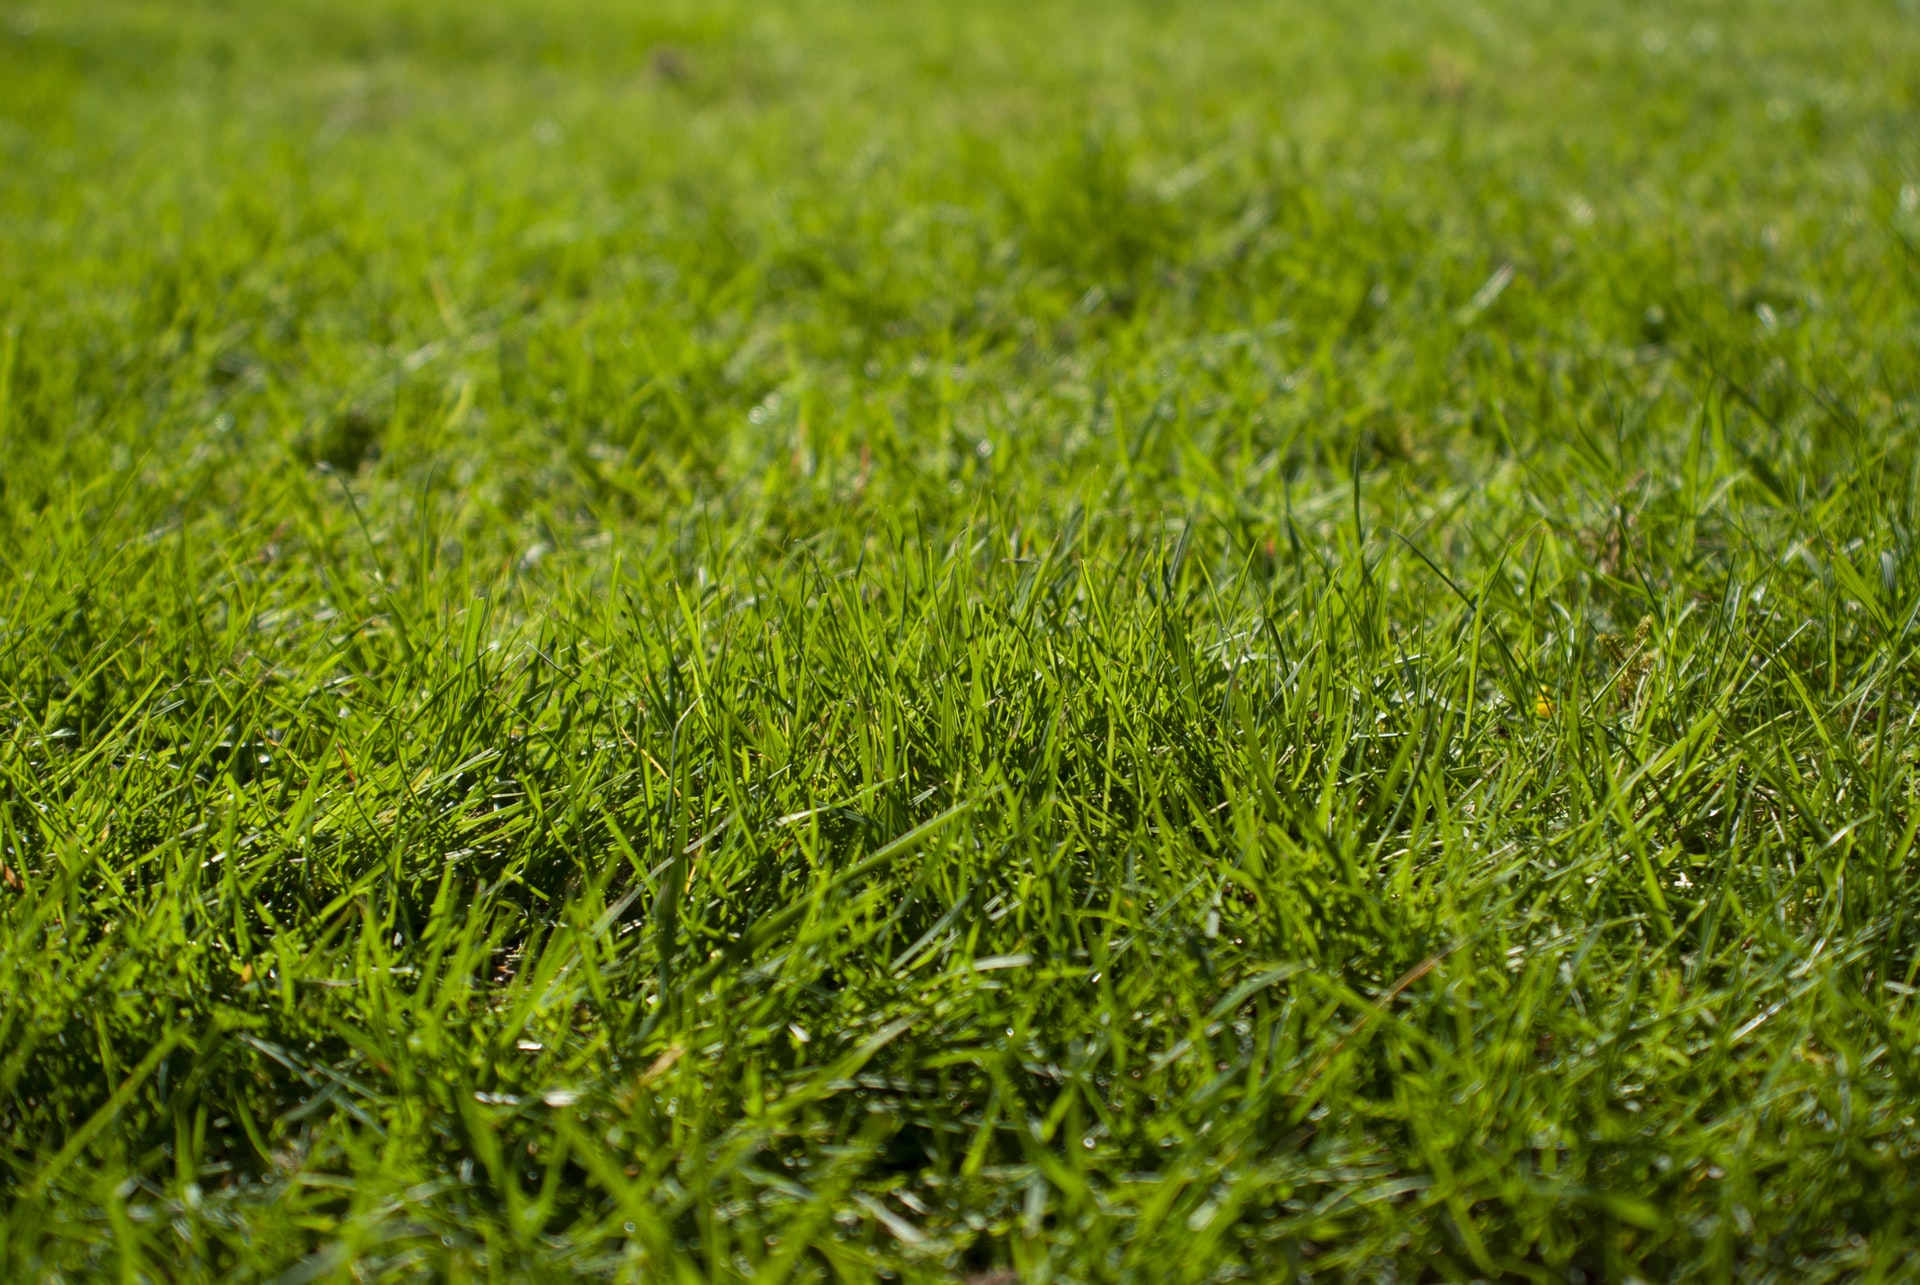
This online ecology practical exercise uses random sampling to measure the abundance of various different species on an area of grassland.
The resources are intended to help students develop skills and plant identification techniques before going out into the field, rather than to replace fieldwork.
To give students practice at:
- using random sampling to measure the abundance of various different species on an area of grassland.
To give an opportunity to explore two different measures of abundance:
- density: the number of individual plants per quadrat or per unit area
- frequency: the proportion of quadrats each species occurs in
The site chosen
The grassland contains a small number of easily identifiable species. The sampling area is relatively small, making it possible to take a reasonable sample using 25cm x 25 cm quadrats (i.e. at sampling at least 2% of the total area). The small quadrat enables us to provide a close up image of the whole quadrat allowing identification of individual species.
- ‘Lawn survey – area being sampled’ – an aerial view of the piece of grassland being sampled in this exercise. This is 5 m x 5 m. Tapes have been laid along two edges divided into 0.25 m intervals which are the length of one side of the quadrat being used. Follow the link to view this.10 pairs of random intervals are placed alongside this.
- ‘Lawn quadrats’ – 10 quadrats each supplied as a separate image. Each is hot linked to one of the pairs of coordinates given above.
- ‘ID and recording tables’ – Tables supplied for recording results (either as density, or as frequency) together with images and names of each of the species likely to be seen. No attempt has been made to separate the grass species but Perennial rye-grass Lolium perenne is the most common species. Download these from the links on the right.
Suggestions for carrying out the exercise
Introduction
Explore the students’ ideas about how they would go about measuring the abundance of different species in an area of grassland.
What they would measure How they would sample
Explain the principle of random sampling and how it is done in practice. Relate this to how it is going to be done in this exercise. Explain how the sampling interval is related to the quadrat size.
1. Allocate each pair or small group of students a pair of random intervals and ask them to find their quadrat. Give them a species identification (density) results table.
Ask them to try and measure density i.e. the number of plants of one or two species e.g. the number of clover plants, the number of daisy plants, in their quadrat. (You may want to put in a bit of time to practise identification).
2. They will soon see that this is difficult. In addition you can show them how many leaves like white clover, are linked by horizontal creeping stems. It is difficult to define what an individual plant is and this measure, density, gives you no indication of the size of the plants.
A better measure is frequency (the number of quadrats which each species occurs in.) This is related both to the number of plants and their size and therefore is ecologically more meaningful.
3. To measure frequency, ask them to record the presence or absence of each species in their quadrat. Using a species identification (frequency) results table. Collate results for the 10 quadrats (using a simple spreadsheet) and calculate the percentage frequency for each species – the number of times present out of 10 x 100.
4. You may wish to discuss the measurement of cover (the area of ground covered by each species). This can be measured using point quadrats or is often estimated visually. Measuring frequency usually gives a more reliable result than visual estimation of cover.
Random sampling is a way of eliminating personal choice in the selection of a sample. Every part of your sample area should have an equal chance of being sampled every time you go to take a sample. For this reason the sampling interval should be the same size as the quadrat. For example in this exercise the quadrat is 25 cm x 25 cm and the tapes along the two sides of the plot are therefore divided into 25 cm intervals.
The co-ordinates of pairs of randomly selected intervals determine the quadrat positions.
To create random intervals the simplest way is to write the 0.25 intervals from 0-10 on pieces of paper and draw them out of a hat. Note replace each piece of paper before drawing out the next.
In practice particularly when working under difficult conditions (torrential rain!!) or with younger students one concentrates on eliminating personal choice. In this case the surveyors find their co-ordinates by walking along the tapes the number of paces indicated by the random numbers rather than measuring intervals along the tape.
Note that throwing quadrats is not random sampling and at best eliminates a certain amount of personal choice!
For more information about quadrats and sampling see ‘ Questions about quadrats ‘.
For practical fieldwork ideas and information look at the Online Resources on the Field Studies Council website – http://www.field-studies-council.org/resources/
What's included?
- SAPS Ecology 1 Abundance and Random Sampling Technical and Teaching Notes
- SAPS Ecology 1 Abundance and Random Sampling ID and recording table 1 Density
- SAPS Ecology 1 Abundance and Random Sampling ID and recording table 2 Frequency
- SAPS Ecology 1 Abundance and Random Sampling ID recording tables density and frequency
Related content
Teaching resources.
- Ecology Practical 2 - The distribution of species across a footpath
- Ecology Practical 3 - Abundance and random sampling at Waun Las Nature Reserve, Wales
- Questions about Quadrats
- Birmingham Institute of Forest Research climate change resources

Topics For Experiments In Ecology
Ecology is the study of intricate interactions among living and nonliving things and their environment, and the balance of ecology helps determine the very health and well-being of our planet. Designing ecology experiments around something as complex as ecology might sound overwhelming.
But ecology embraces many fascinating areas of science, including ecosystem ecology, animal behavior, population ecology and physiological ecology.
Ecosystem Ecology Experiments
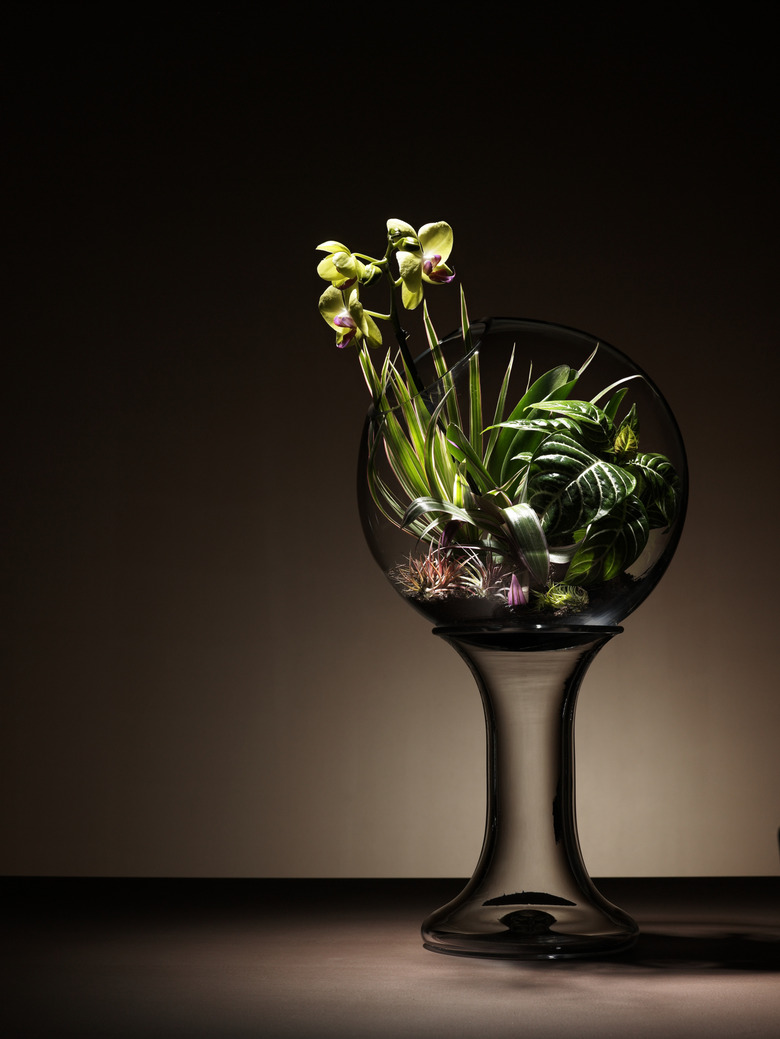
An ecosystem consists of the living, or biotic, and nonliving, or abiotic, parts of an interrelated community. Abiotic aspects of an ecosystem include soil, air, water, sunlight and the chemistry of soil and water. Biotic components include plants, herbivores, carnivores and detrivores.
To illustrate how an ecosystem works, try building two or more identical miniature land or water ecosystems in a large covered jar or aquarium. Provide the necessary components of a typical ecosystem, including:
• Edible plants • Soil • Small herbivores • Detrivores • Pond water • Air • A light source
Alter one factor in the ecosystem, such as the amount of light or water it receives, while keeping all other factors the same to see what changes occur in the mini ecosystem. Observe the interactions between organisms and test for changes in animal health, water acidity and other detectable changes.
Animal Behavior
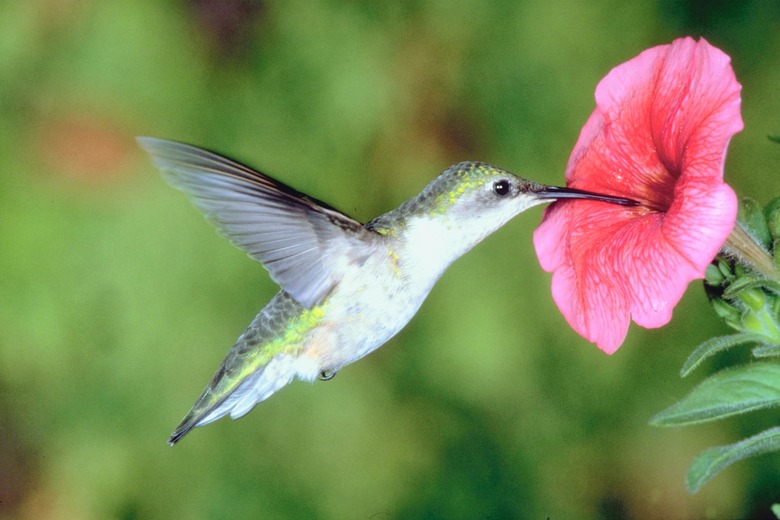
The animals around us are entertaining and fascinating to observe. Using a bit of scientific discipline, it is possible to turn those observations into a science experiment.
Try setting up clear glass hummingbird feeders containing sugar water in different colors and observe which feeders the birds seem to prefer. What connection might this have to the adaptations the hummingbird has developed to survive in its environment?
You could go even smaller and take it into a classroom by studying small and easily managed animals like insects or hermit crabs. Set up a living area for these animals and take daily observations.
Create some ecology hypothesis ideas before making observations and see if the reality lines up with your hypothesis. Take notes on how they interact with each other, what type of food they prefer, where they stay in their enclosure and more.
Did your hypothesis hold up to the observations you made? Why or why not?
Population Ecology Projects
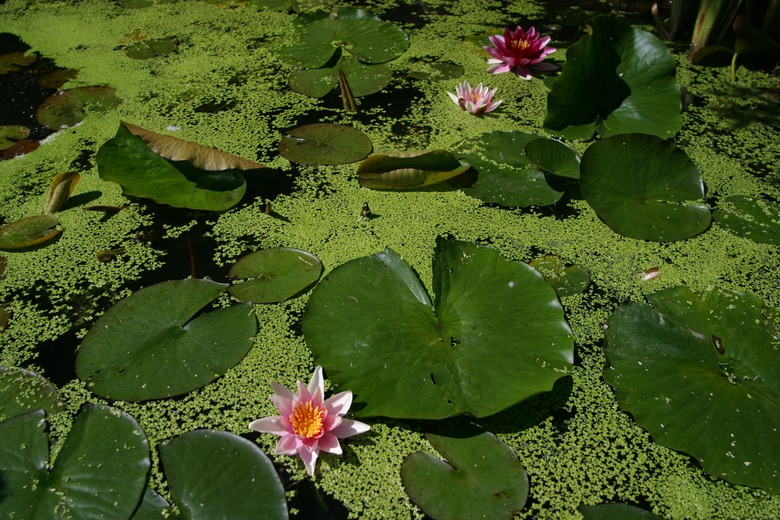
Population ecology examines factors that affect the population of a certain species, such as food availability, temperature, predators or overcrowding.
To do a population ecology study, tally a food source — for example, plants — in a measured area and record changes over time in the population of consumers.
Or place different numbers of a species of plant or small animal — for example, duck weed or crickets — in two or more identical mini aquariums or terrariums. Provide them the same amounts of food, space and light, and then observe how population density affects their population growth.
You can also create a project that looks at data already collected by other scientists. Go online and find long-term population data on wolves in a national park, for example. Then, create a hypothesis as to why the population changed or stayed the same over time. Do other research to see if your hypothesis is supported.
Physiological Ecology Experiments
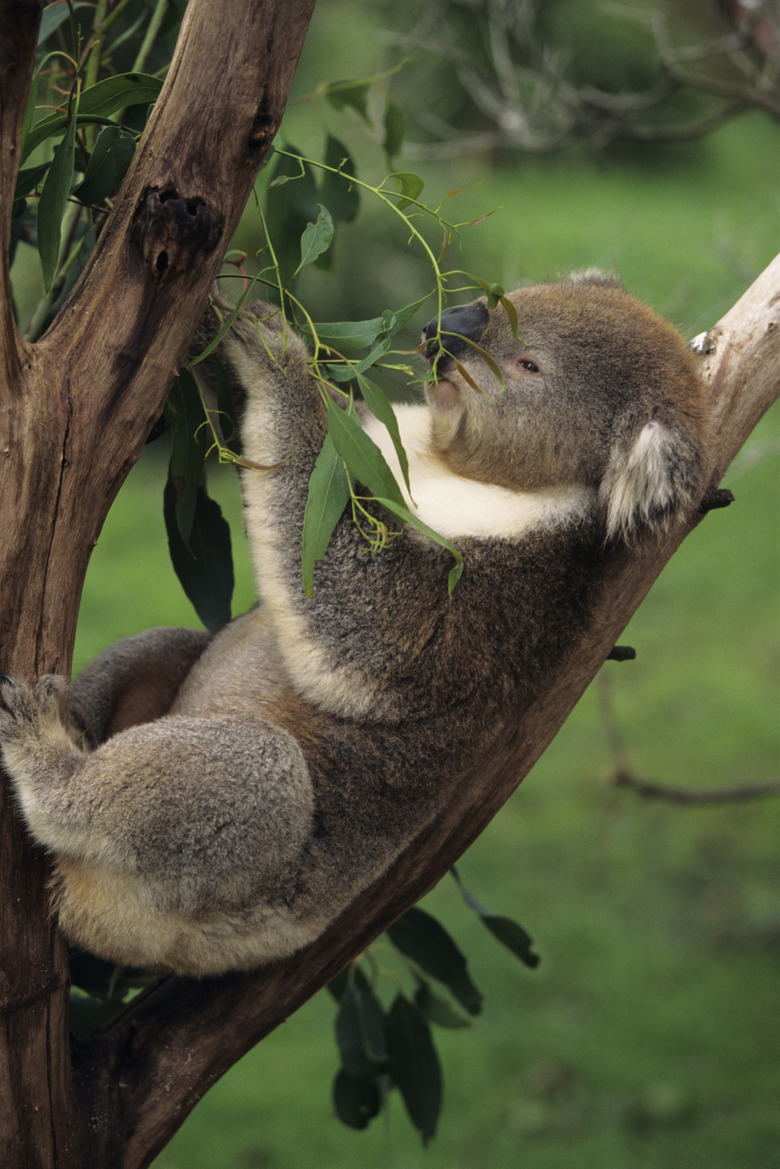
A physiological ecologist studies how an organism's body is adapted to its environment and how changes in the environment — such as temperature, chemicals or resource availability — affect it. To study the physiological ecology of an organism, design an experiment to observe the effect of rising temperatures — such as those caused by climate change — on the growth of that organism in a controlled laboratory environment.
Or observe the effects of acid rain on a species of plant in a laboratory setting, using vinegar in water to simulate rain acidity caused by coal-burning power plants.
- The Nature Education Knowledge Project: Ecology
- Regents of the University of Michigan: The Concept of the Ecosystem
Cite This Article
Carter, Kari Norborg. "Topics For Experiments In Ecology" sciencing.com , https://www.sciencing.com/topics-experiments-ecology-9307/. 19 June 2019.
Carter, Kari Norborg. (2019, June 19). Topics For Experiments In Ecology. sciencing.com . Retrieved from https://www.sciencing.com/topics-experiments-ecology-9307/
Carter, Kari Norborg. Topics For Experiments In Ecology last modified August 30, 2022. https://www.sciencing.com/topics-experiments-ecology-9307/
Recommended

IMAGES
COMMENTS
ADVERTISEMENTS: Are you researching on experiments on ecology ? You are in the right place. The below mentioned article includes a collection of nineteen experiments on ecology: 1. Community Structure Study 2. Biomass Study 3. Soil Science 4. Aquatic Ecosystem 5. Physico-Chemical Analysis of Water. Contents: Experiments on Community Structure Study Experiments on Biomass Study […]
Ecology science experiments you can do at home! Click on the experiment image or the view experiment link below for each experiment on this page to see the materials needed and procedure. Have fun trying these experiments at home or use them for SCIENCE FAIR PROJECT IDEAS.
School Ecology Practicals This site lists my favourite ecology practical resources, bringing together resources from other sites. It's still a work in progress, and some practicals (at the bottom of the page) are just an idea without resources.
Mar 28, 2023 · We will explore 20 ecological activities that can be carried out in a classroom or homeschool setting. From simple experiments to outdoor explorations, creative projects, and interactive games, these activities will teach students about energy conservation, waste reduction, water conservation, and sustainable living. By participating in these activities, students will become advocates for the ...
Acid Rain Lab- Katherine Betrus Derrico 2012 CIBT Alumni Workshop Ecology High School Inquiry/Scientific Method Middle School Plants. Students will design and conduct an experiment to test the effect of acid rain on the germination of seeds. They will utilize the data from their experiment to explain their conclusions, and also read a passage ...
This online ecology practical exercise uses random sampling to measure the abundance of various different species on an area of grassland. The resources are intended to help students develop skills and plant identification techniques before going out into the field, rather than to replace fieldwork. Objectives. To give students practice at:
In ecology, a biome is a major regional group of distinctive plant and animal communities best adapted to the region's physical natural environment, latitude, elevation, and terrain. A biome is made up of ecoregions or communities at stable steady state and all associated transitional, disturbed, or degraded, vegetation, fauna and soils, but ...
Introduction to Ecology Outline of Lecture 1. Branches of ecology 2. Factors affecting species distribution 3. Biomes Climate - temperature and water Dominant species Terrestrial and aquatic Reading: Chapter 50 – Introduction, today Chapter 52 – Population ecology, today and W Chapter 54 – Ecosystem ecology, W&F Lab practical next week ...
Apr 24, 2017 · The broad subject of ecological studies offers many opportunities for easy, hands-on experiments and demonstrations. Simple methods and materials can help to illustrate larger ecological issues and phenomena. These examples illustrate stormwater issues, algae blooms, the effect of composting waste instead of landfilling and the intrusion of non-native plants.
Jun 19, 2019 · Ecology is the study of intricate interactions among living and nonliving things and their environment. Designing ecology experiments might sound overwhelming. But ecology embraces many fascinating areas of science, including ecosystems, animal behavior, populations and physiological ecology.